Data, Graphing, and Probability : Preschool and Kindergarten Math Worksheets
This page contains all our printable worksheets in section Data, Graphing, and Probability of Preschool and Kindergarten Math. As you scroll down, you will see many worksheets for make concrete graphs, read and make picture graphs, reading data, read and make tally tables, more or less likely, and more.
A brief description of the worksheets is on each of the worksheet widgets. Click on the images to view, download, or print them. All worksheets are free for individual and non-commercial use.
View the full list of topics for this grade and subject categorized by common core standards or in a traditional way.
Practice to read and use data from a table.
Category: Data, Graphing, and Probability Reading Data
Use data from the bar graph to answer each question.
Category: Data, Graphing, and Probability Reading Data
Read the bar graph to answer the questions.
Category: Data, Graphing, and Probability Reading Data
Read the graph to answer each question. ( 2 pages )
Category: Data, Graphing, and Probability Reading Data
Students will read the tally chart and complete the graph.
Category: Data, Graphing, and Probability Collecting/Organizing Data
Color the buttons on each clothing. Then complete the graph according to the number of each type of button.
Category: Data, Graphing, and Probability Collecting/Organizing Data
Count each type of zoo animal, color in the same number of boxes on the table to make a bar graph. Answer the questions.
Category: Data, Graphing, and Probability Collecting/Organizing Data
Count the pictures, then make your own graphs.
Category: Data, Graphing, and Probability Collecting/Organizing Data
Count the pictures. Draw an 'X' in the table to show the correct number of objects.
Category: Data, Graphing, and Probability Collecting/Organizing Data
Look at the pictures, then circle the correct table graph.
Category: Data, Graphing, and Probability Collecting/Organizing Data
Count the pictures, then circle the correct table graph.
Category: Data, Graphing, and Probability Collecting/Organizing Data
Students will create a pictograph and answer questions.
Category: Data, Graphing, and Probability Picture Graphs
Create a pictograph, then answer the questions.
Category: Data, Graphing, and Probability Picture Graphs
Create a pictograph, then answer the questions.
Category: Data, Graphing, and Probability Picture Graphs
Read the picture graphs to answer each question.
Category: Data, Graphing, and Probability Picture Graphs
Count and write the correct number of tally marks, then answers the questions.
Category: Data, Graphing, and Probability Tally Tables
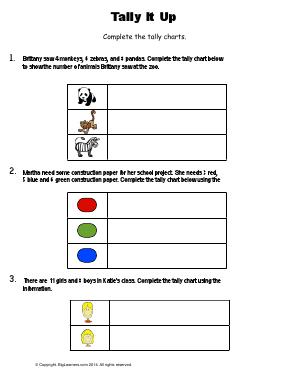
Read the word problems to complete the tally tables.
Category: Data, Graphing, and Probability Tally Tables
Read the word problems, then complete the tally tables.
Category: Data, Graphing, and Probability Tally Tables
Count the shapes and write the tally marks.
Category: Data, Graphing, and Probability Tally Tables
Count and write the number of tally marks.
Category: Data, Graphing, and Probability Tally Tables
Count the sweet treats, use tally marks and the number form to show the correct number of each treat.
Category: Data, Graphing, and Probability Tally Tables
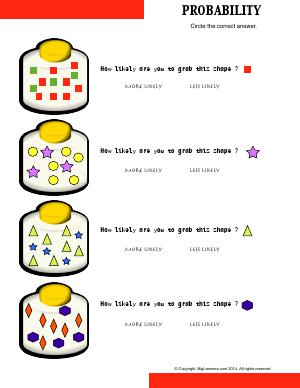
Learn and practice the concept of probability.
Category: Data, Graphing, and Probability More or Less Likely


