CCSS.MATH.CONTENT.3.MD.B.3 : Third Grade Math Worksheets
About 3.MD.B.3
Draw a scaled picture graph and a scaled bar graph to represent a data set with several categories. Solve one- and two-step "how many more" and "how many less" problems using information presented in scaled bar graphs. For example, draw a bar graph in which each square in the bar graph might represent 5 pets.
Here is a collection of our common core aligned worksheets for core standard 3.MD.B.3.
A brief description of the worksheets is on each of the worksheet widgets. Click on the images to view, download, or print them. All worksheets are free for individual and non-commercial use.
Please visit 3.MD.B to view our large collection of printable worksheets. View the full list of topics for this grade and subject categorized by common core standards or in a traditional way.
Read and interpret the graph to answer the questions.
Core Standard: 3.MD.B.3
Use data from tally tables to complete each pictograph. Then answer the related questions.
Core Standard: 3.MD.B.3
Use the data from the pictographs to answer the questions.
Core Standard: 3.MD.B.3
Read the bar graph to answer the questions.
Core Standard: 3.MD.B.3
Use data from the table to make a bar graph, then answer the questions.
Core Standard: 3.MD.B.3
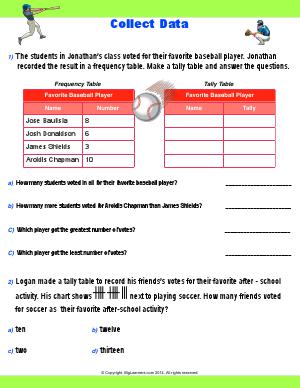
Learn to read and record data in tally tables and frequency tables.
Core Standard: 3.MD.B.3
Use the data from the table to make a line plot. Then answer the questions.
Core Standard: 3.MD.B.3
Read the line graph and answer the questions.
Core Standard: 3.MD.B.3
Use the data from the van diagram to answer the questions.
Core Standard: 3.MD.B.3


